Market News
Bitcoin Market Update: Traders Question Whether There's a Breakout or Breakdown Looming - BITCOIN.COM
As of Oct. 22, 2024, bitcoin (BTC) is priced at $67,058.95, fluctuating within a 24-hour range of $66,669 to $68,268. With a market cap of $1.32 trillion and a daily trading volume hitting $44.03 billion, the digital currency appears to be in a consolidation phase, according to technical indicators. These indicators suggest that while things are steady for now, volatility could be just around the corner.
Bitcoin
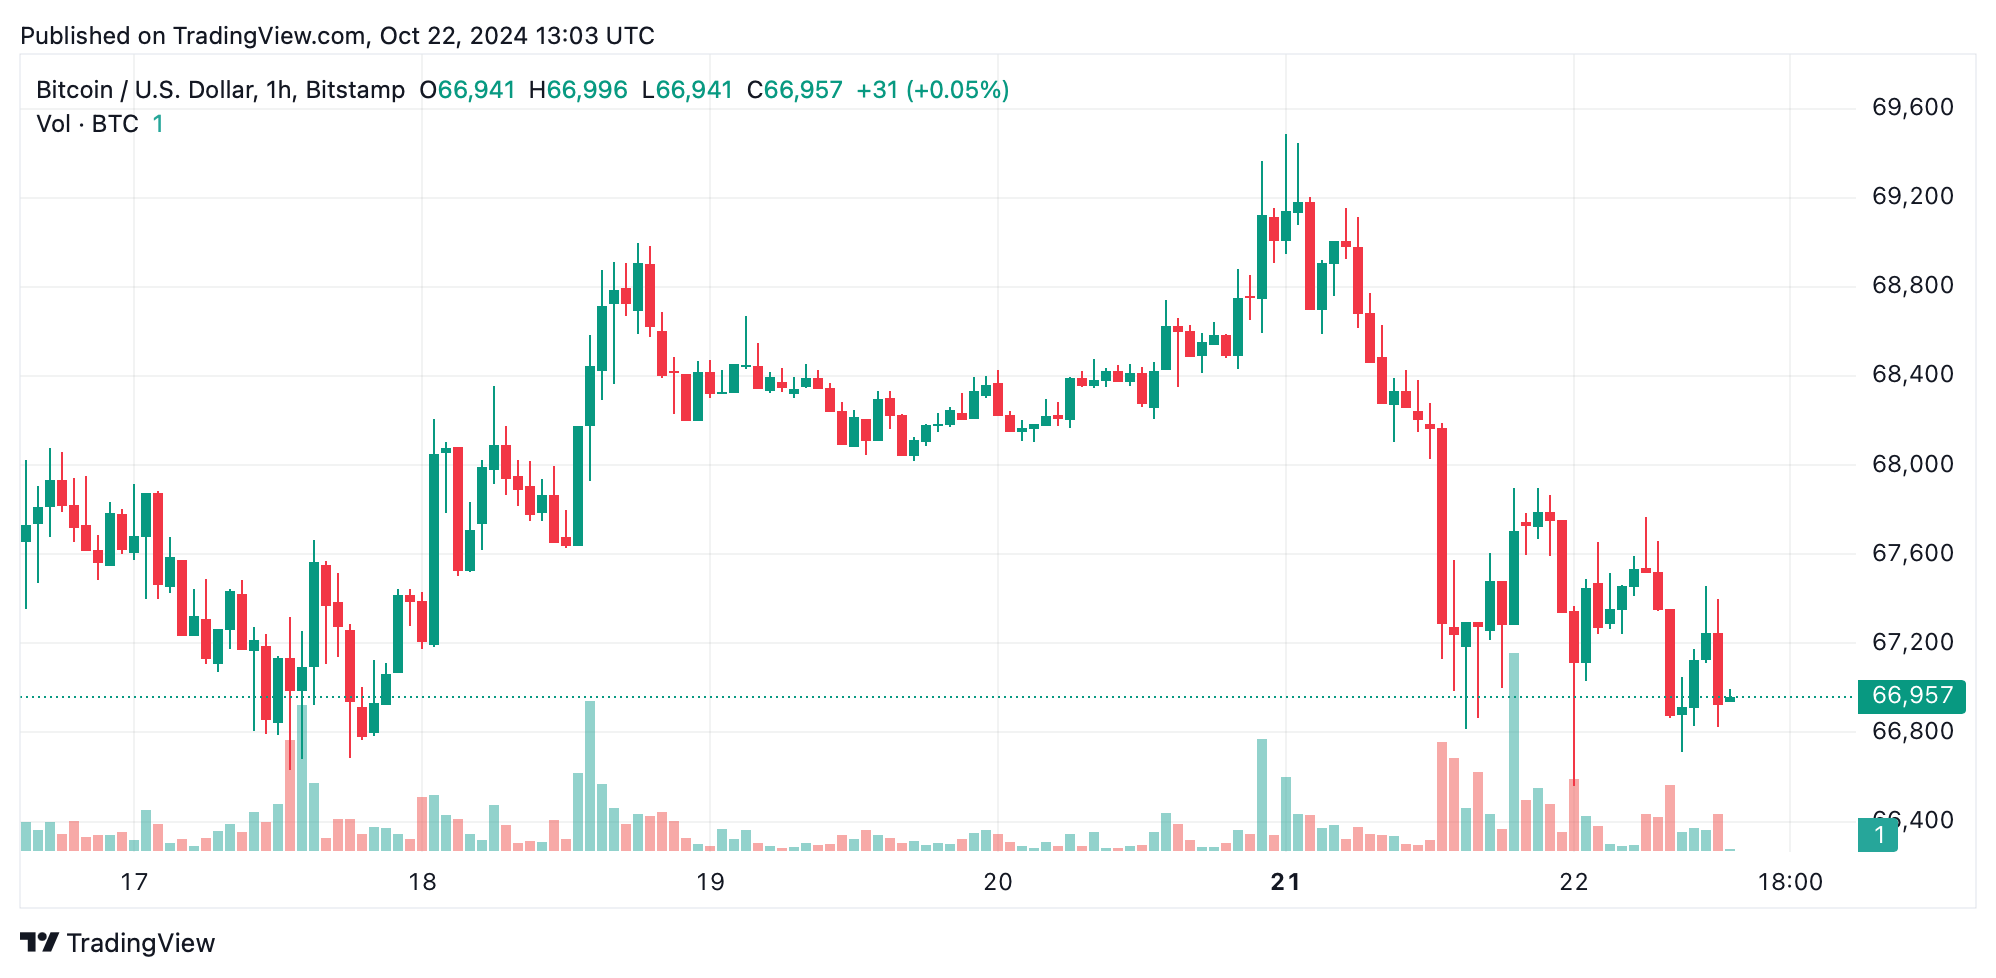
On the 1-hour chart, bitcoin seems to be consolidating between $66,559 and $67,500. Following a drop from $69,156 to $66,559, the recovery has been slow, and volume has noticeably declined. A prominent drop with high volume reflects mounting selling pressure. The relative strength index (RSI) remains neutral at 60, while the momentum oscillator indicates a negative signal. Moving averages send mixed signals: the exponential moving average (EMA) at 10 sits at $66,790, suggesting bullish momentum, while the simple moving average (SMA) at 10, at $67,111, signals bearish pressure. A breakout above $67,500, accompanied by strong volume, could shift momentum upward.

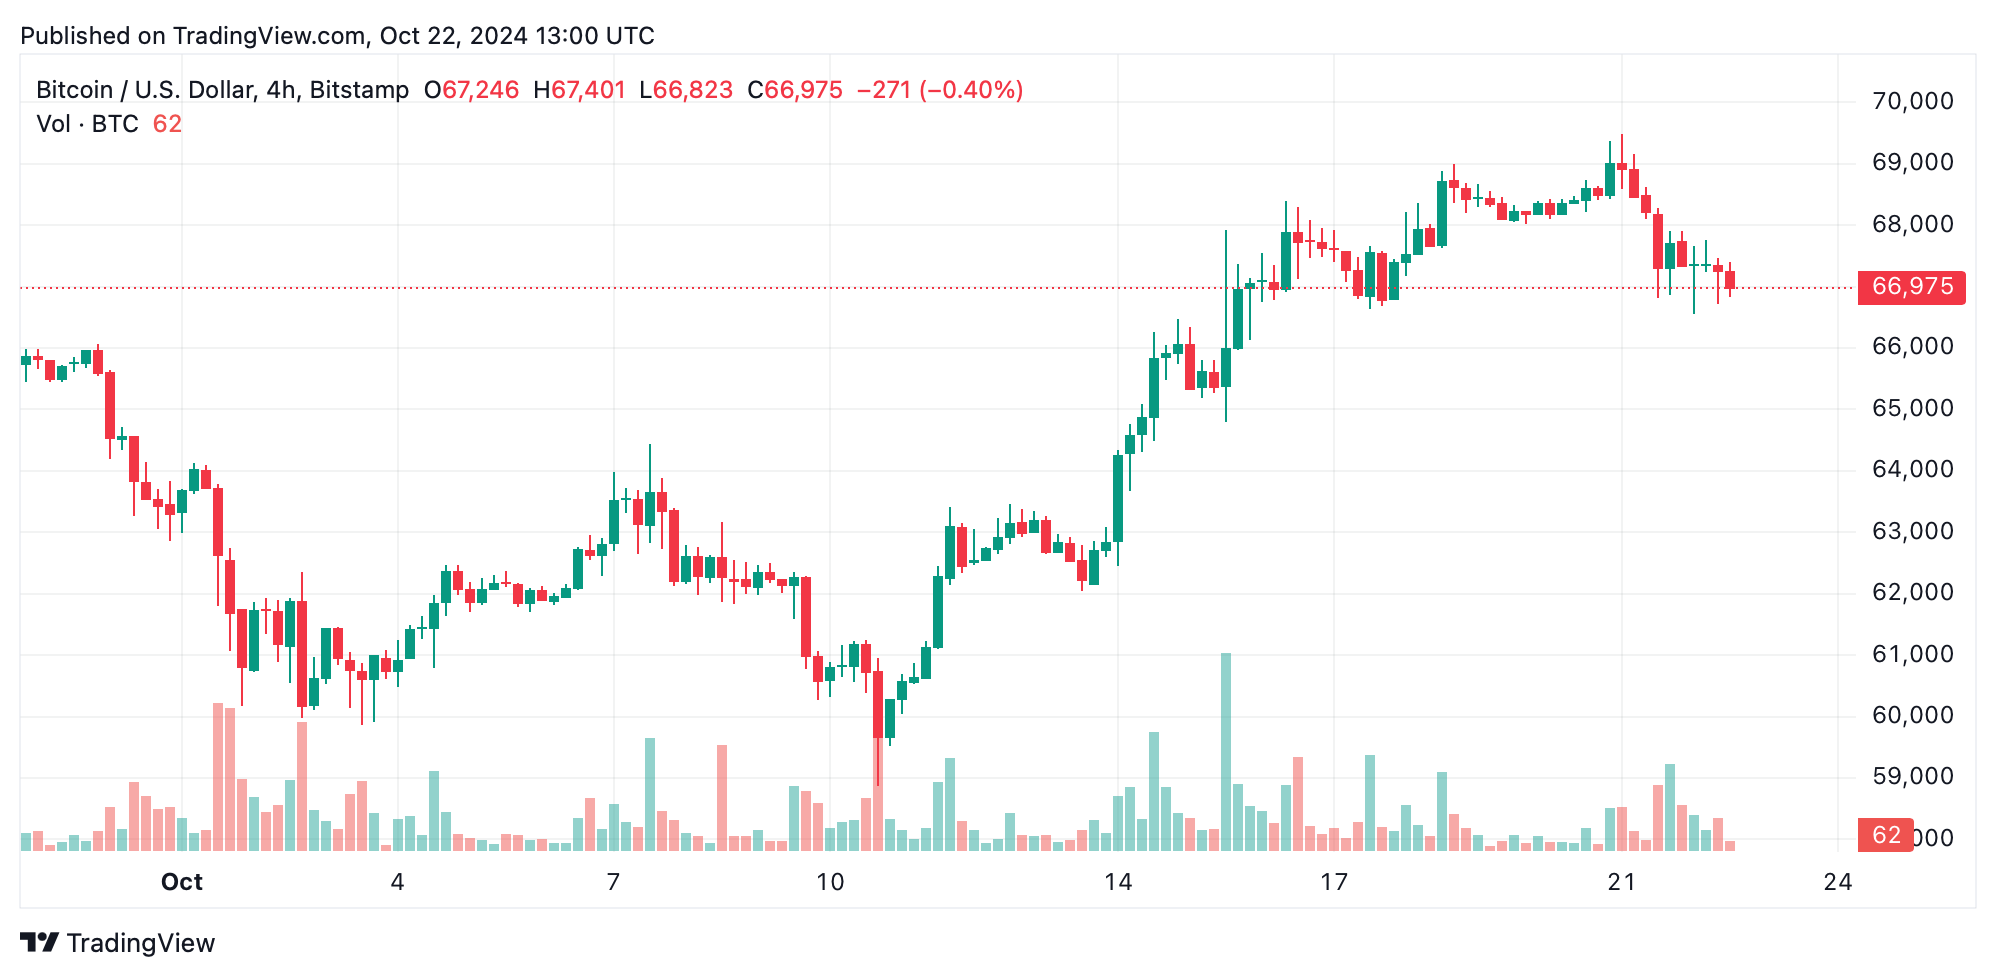
Zooming out to the 4-hour chart, bitcoin experienced a sharper decline from $69,487 to $66,559, with a slight bounce afterward. This suggests that bulls are defending the $66,500 level, though bearish sentiment still lingers. The RSI remains neutral, and the Stochastic oscillator shows an overbought condition at 84 but stays neutral. The moving averages here give the bulls a slight edge, with the 20-period and 50-period EMAs and SMAs indicating bullish signals. A potential retest of $66,000 could provide a better risk-reward entry, while resistance at $69,000 may create challenges for further upward movement.

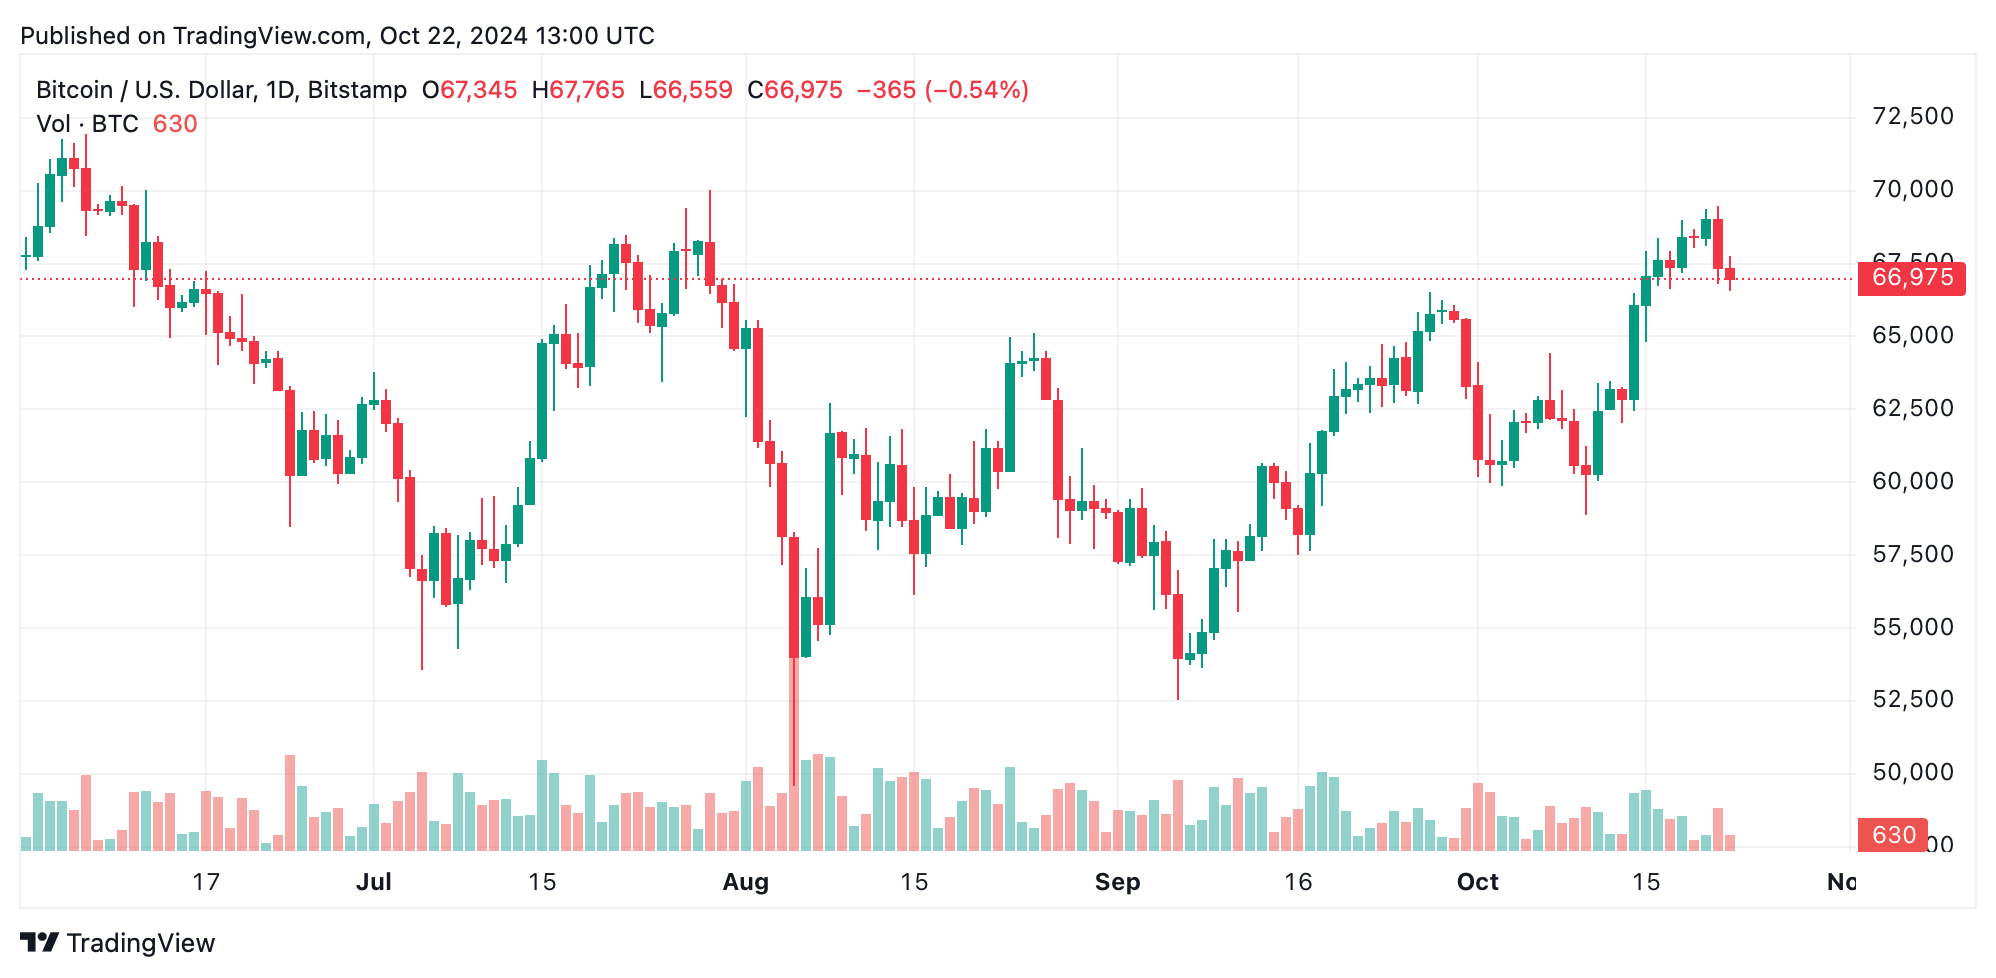
On a broader daily chart, bitcoin reflects a correction from its recent high of $69,487. A large decline followed by smaller bearish drops indicates sustained downward pressure. The commodity channel index (CCI) at 66 and the average directional index (ADX) at 21 both point to a weakening trend. However, the moving averages remain bullish, with the 50-day EMA at $63,401 and the 100-day SMA at $62,054 both issuing positive signals.
Across all timeframes, oscillators present a neutral stance. The RSI stays consistent, suggesting neither overbought nor oversold conditions. Yet, momentum gives off a sell signal, sitting at 3,793, while the awesome oscillator remains neutral at 3,980. The moving average convergence divergence (MACD), with a level of 1,651, offers a bullish crossover on the longer-term charts, hinting at potential upward momentum. However, the variety of mixed signals calls for cautious optimism from traders.

Overall, moving averages across different timeframes lean towards a bullish perspective, especially on the medium to long-term charts. On the 1-hour chart, both the EMA (10) and EMA (20) signal buy opportunities at $66,790 and $65,415, respectively. Similarly, on the 4-hour chart, the 50-period EMA and SMA signal buy opportunities at $63,401 and $62,108, respectively. Long-term investors can find some reassurance in the strong support from the 200-day EMA at $60,743 and the 200-day SMA at $63,326, both signaling buy indications and reinforcing bitcoin’s potential stability at these levels.
Bull Verdict:
Despite recent short-term corrections, bitcoin’s price remains supported by strong moving averages across all timeframes, particularly the 50-day and 200-day EMAs. The overall bullish sentiment from these indicators, coupled with a potential upside break above $67,500, suggests that bitcoin could be poised for another upward leg, especially if buying volume increases. As long as key support levels hold around $66,500, the market may shift in favor of bulls.
Bear Verdict:
The current neutral to bearish oscillators, alongside declining volume, signal a lack of strong momentum, which may weigh on bitcoin’s ability to break out of its consolidation phase. The sell signal from the momentum oscillator and the overbought conditions on the Stochastic suggest that a further drop below $66,500 could trigger additional downside pressure. If BTC breaks critical support at $66,000, a deeper correction toward $65,000 or lower could unfold.


