Market News
Bitcoin: The Path To $117,000 (Technical Analysis) - SEEKING ALPHA
Summary
- BTC-USD has been consolidating within a sideways range, which I view as a bullish "period of consolidation" rather than directionless stalling.
- A "Bull Flag" pattern has formed, with a breakout above $68,426.11 suggesting a potential bullish trend-wave target of $117,361.68.
- Historical examples, like Nvidia, show that these chart patterns can be accurate within a range, though exact precision isn't expected due to heightened cryptocurrency volatility.
- I remain bullish on BTC-USD unless prices fall below $64,778.44, with current momentum potentially driving prices above $100,000 for the first time in market history.
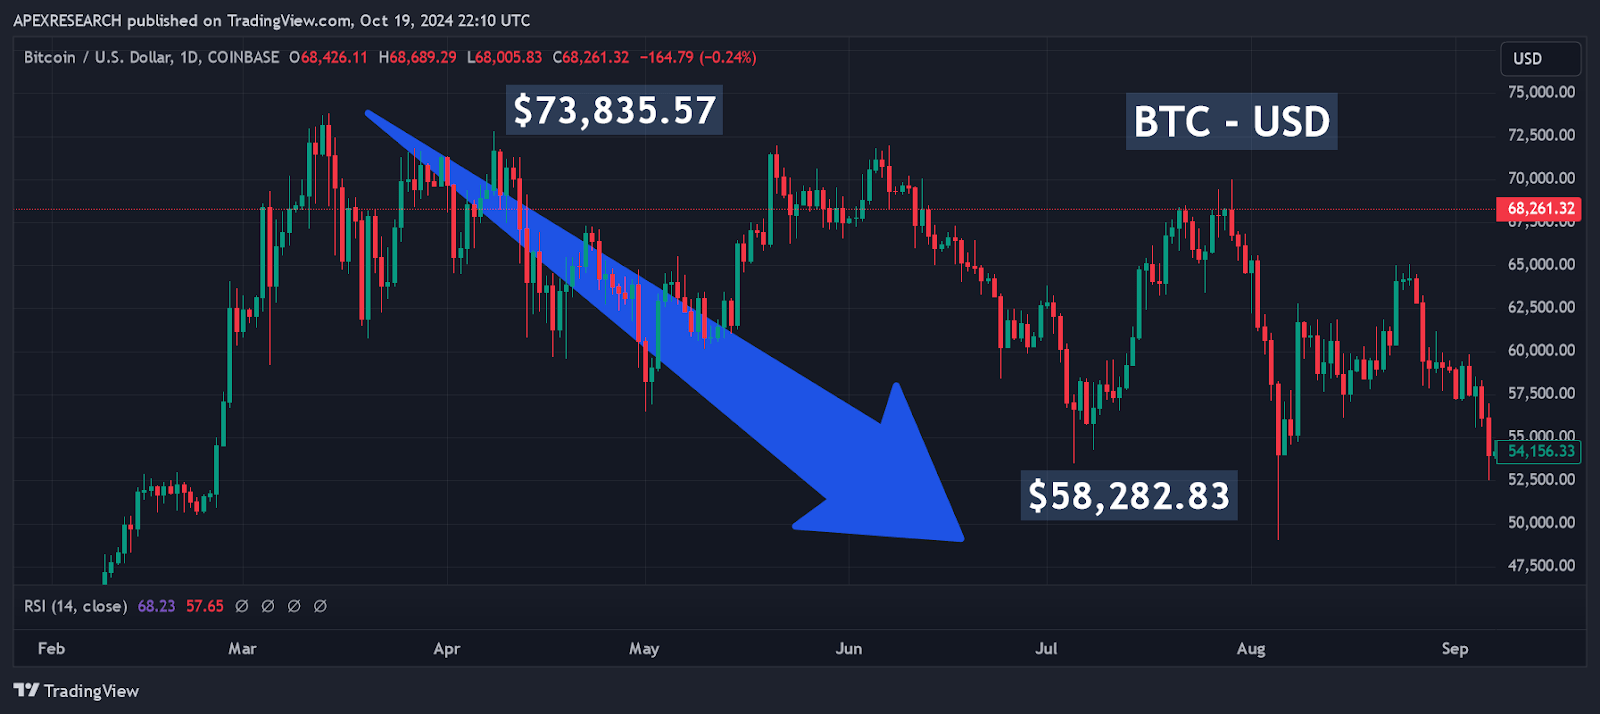
When I last covered Bitcoin (BTC-USD) on April 26th with “Bitcoin: Future Results, Not Past Performance”, the market’s central cryptocurrency pairing was attempting to recover from significant losses that developed during a recent crash from the all-time highs of $73,835.57 posted on March 14th, 2024. Ultimately, this bearish trend wave would go on to generate losses of more than -21.06% before finding a bottom on August 5th (with lows of $58,282.83):
BTC-USD: Prior Market Price Declines (Income Generator via Trading View)
Since then, BTC-USD has traded mostly within a sideways range that cryptocurrency bears might consider to be directionless in nature. Overall, this recent parallel channel has been defined by resistance levels near $70,125, while support zones during this trading period have been largely defined by levels near $53,400:
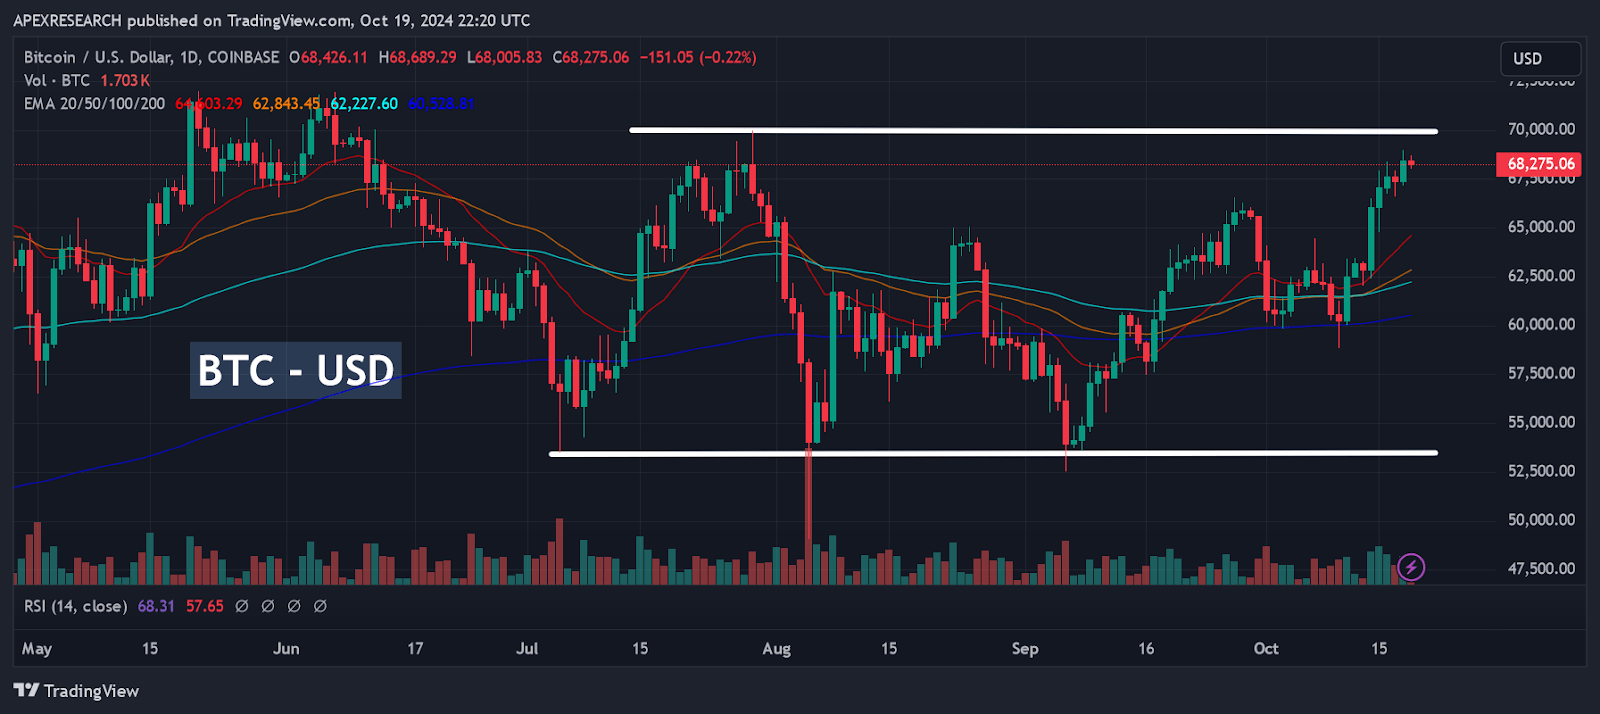
BTC-USD: Trading Range Develops (Income Generator via Trading View)
However, whenever I have heard this criticism of the preeminent cryptocurrency, I have generally taken a bit of a different viewpoint. Rather than viewing this recent price action as “stalling” or as being “directionless”, I have often presented counter-arguments using the phrase “period of consolidation”. In many instances, periods of consolidation are often followed by trending price movements that are much more substantial and decisive in nature. Of course, these types of conditions can occur in both bullish and bearish directions. In this case, I believe that the most probable outcome is one that could center BTC-USD valuations in a decisively bullish direction, and I will make the case for this optimistic argument using a powerful technical analysis chart pattern formation that is called a “Bull Flag”:
BTC-USD: Bull Flag Pattern Emerges (Income Generator via Trading View)
In the chart above, I have outlined the original chart pattern formation that I identified near the end of September. As we can see, the base of the “flag pole” is defined by August-September 2024 support zones near $24,900 and the peak of the structure is formed by the $73,835.57 high posted on March 14th. What follows is a period of sideways consolidation within a parallel price channel that shows a moderately downward trajectory. As a general rule, these price patterns are triggered once we see a convincing break above the top of the “flag” structure, and I prefer to wait until I see a daily or weekly close above these price regions before I execute trading strategies accordingly. Ultimately, I waited to publish this trading idea until I saw a more convincing break of the price pattern because bullish projections are not actually confirmed until market prices break above the top of the “flag” structure.
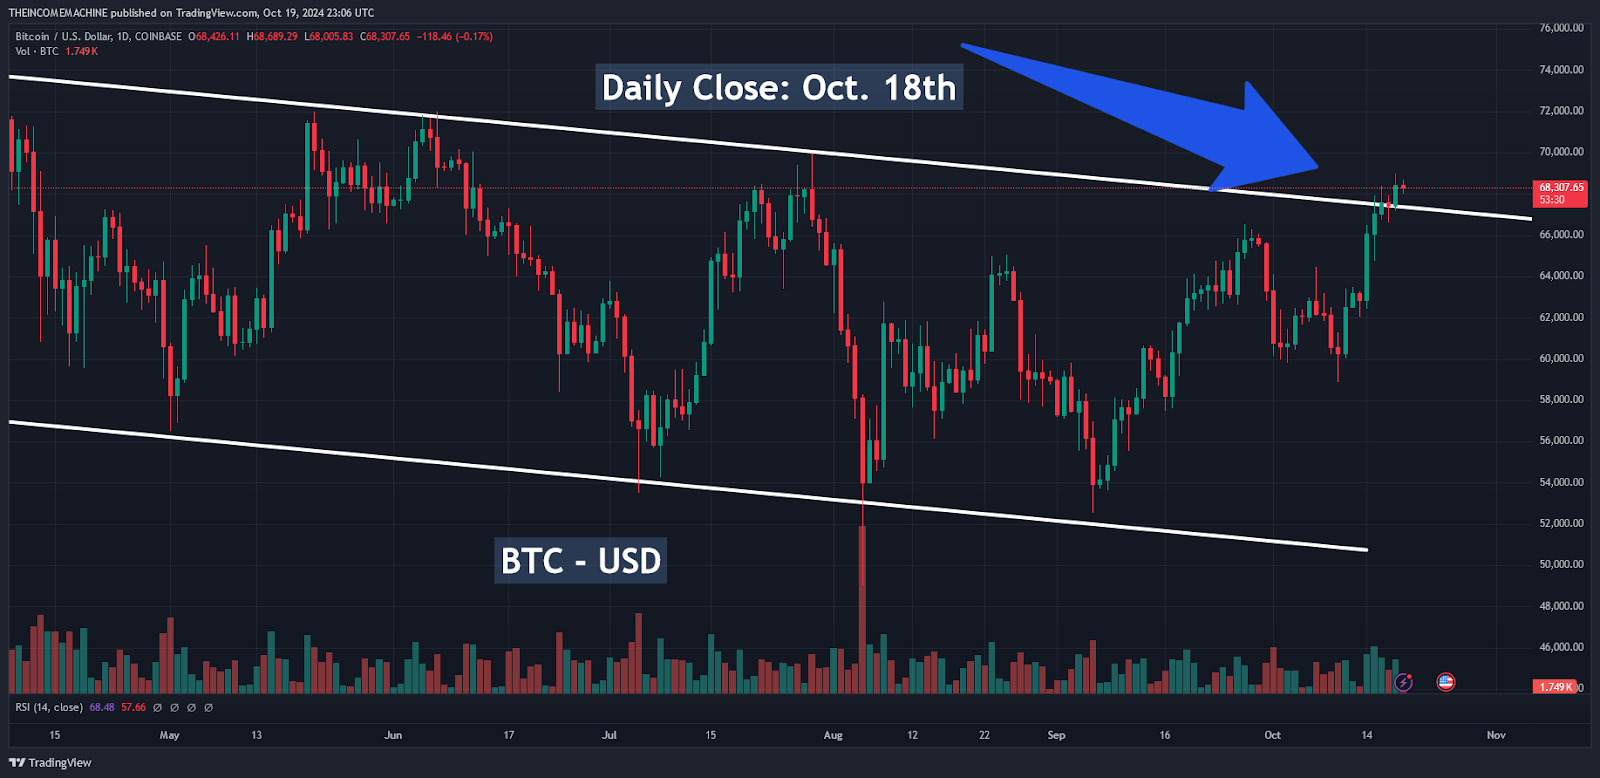
BTC-USD: Critical Upside Breakout Point (Income Generator via Trading View)
In this next price chart, we can see that a more convincingly bullish trigger-signal has finally occurred. Specifically, we will zoom into the most recent daily close (October 18th) in BTC-USD, which was seen at $68,426.11 per coin. Here, we can see that broader trends within the cryptocurrency market have been forceful enough to finally overcome the downward parallel price channel that defines the flag structure, and we must now assess upside projection levels that are typically associated with this type of activity.
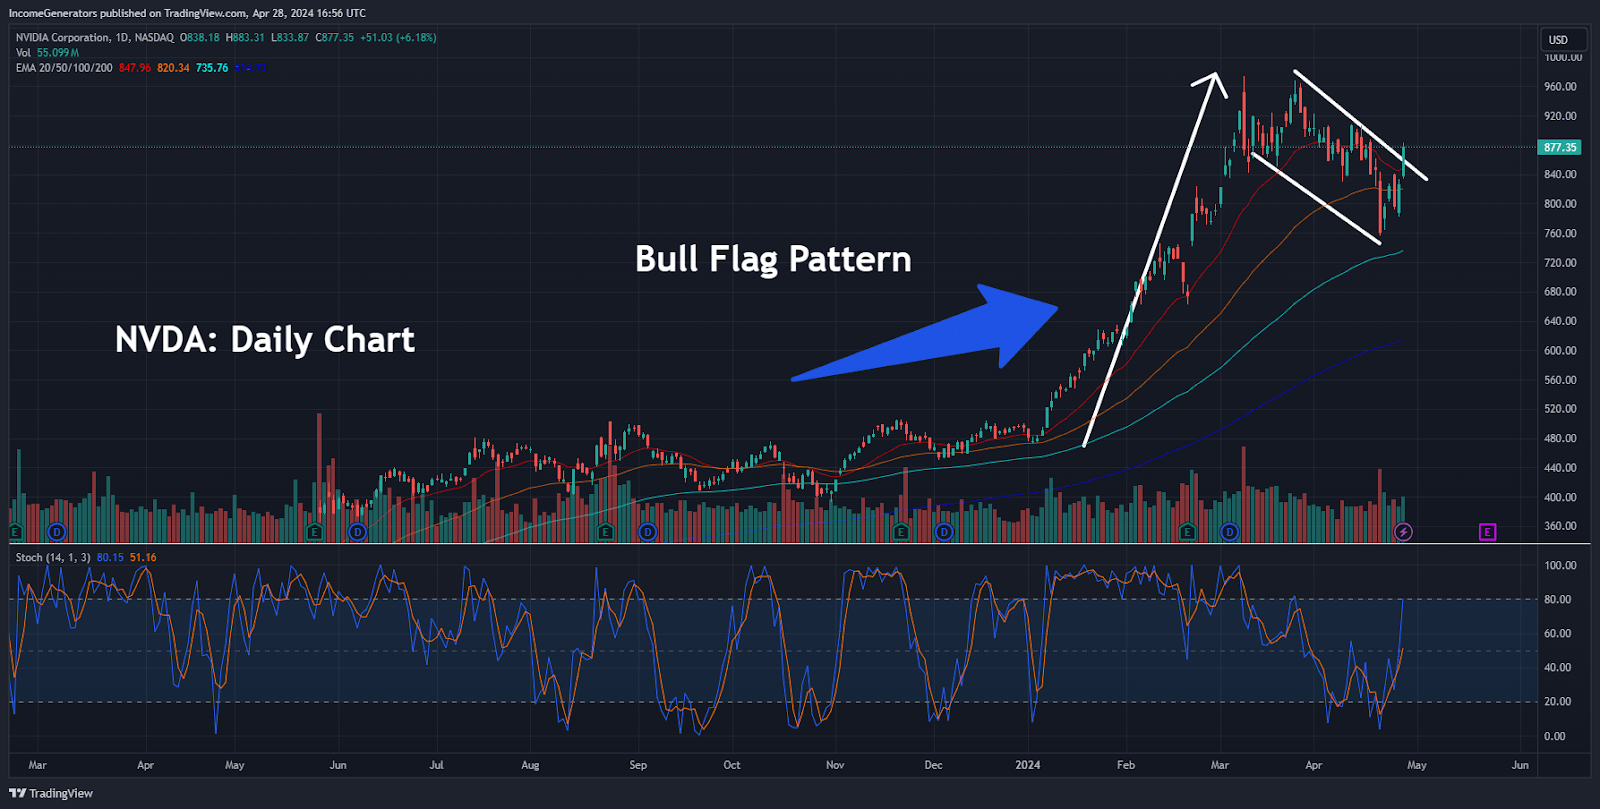
Bull Flag Pattern Example: NVDA (Income Generator via Trading View)
Conventional charting analysis techniques will typically measure the price distance of the initial rally that defined the early structural formations. As an example, we will look at prior price action seen with Nvidia Corp. (NVDA), where a very similar chart pattern occurred earlier this year. I covered this event with a much more in-depth an analysis in my article “Nvidia: Bull Flag Signals Another Major Breakout” published on April 26th, 2024. In the chart image shown above, I outlined the initial price structure (which projected an ultimate upside price target of $138.41). Ultimately, this price projection was based on the April 26th highs (at $88.33) which were then added to the total price distance of the “flag pole” structure (which was $50.08):
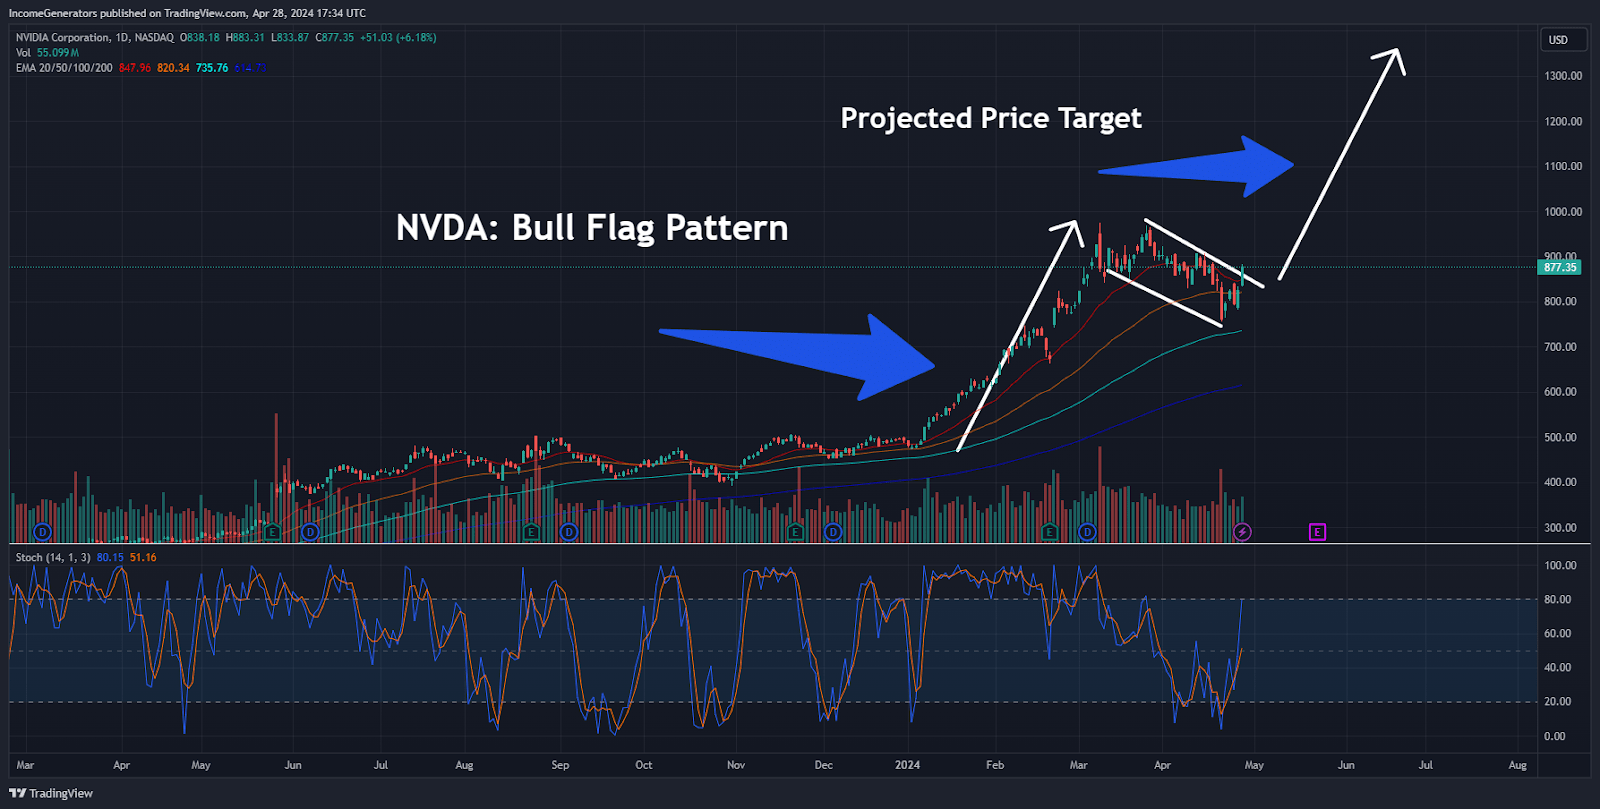
Bull Flag Pattern: Projected Price Targets (Income Generator via Trading View)
Finally, we must visualize the ways these chart projections actually developed in real-time because the results were quite astonishing. For readers that are interested, I covered this outcome in a more in-depth way in my follow-up article “Nvidia: Bull Flag Aftermath”, which was published on October 1st, 2024:
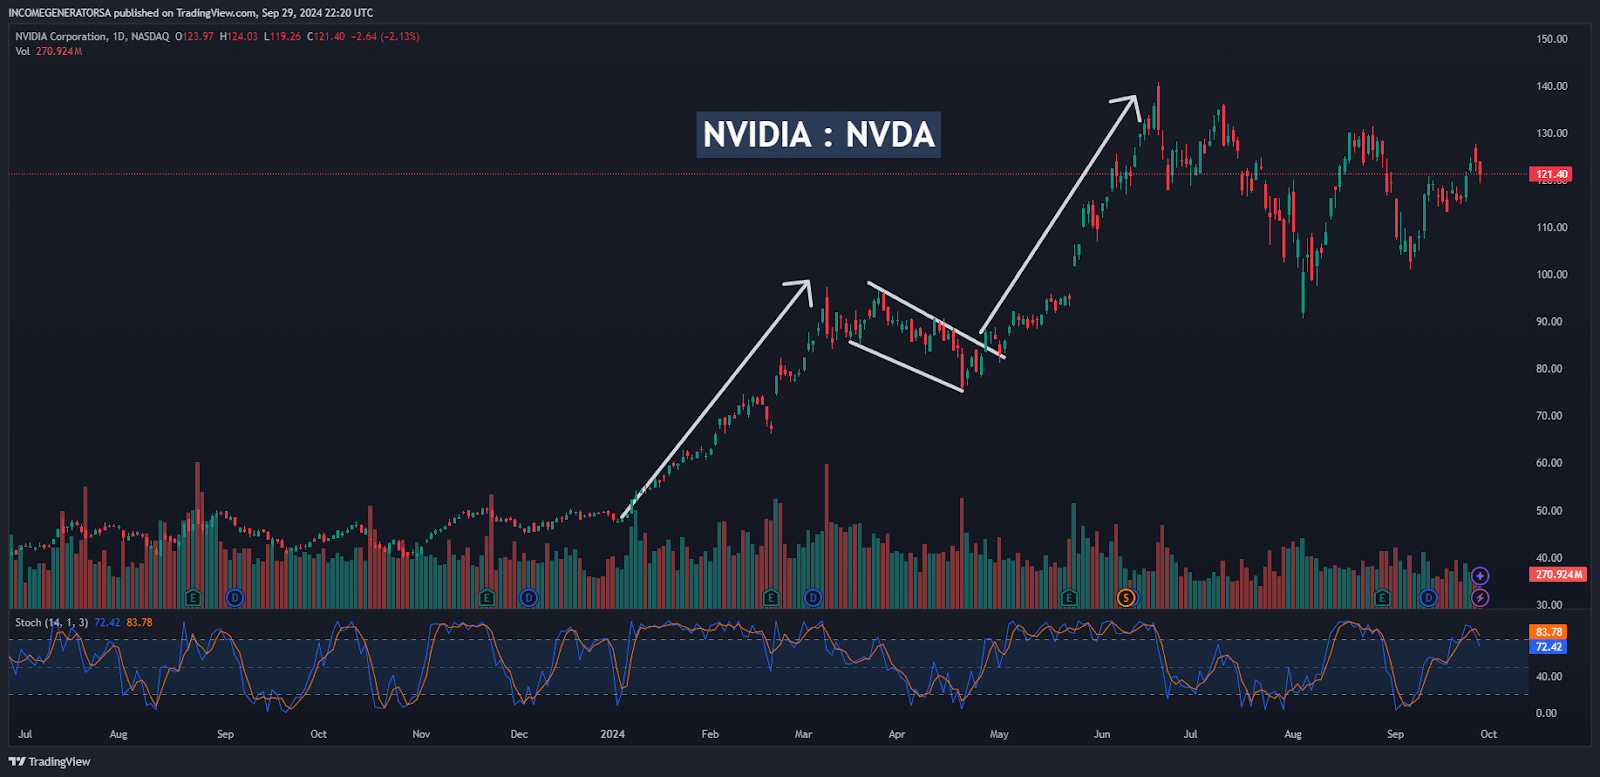
Bull Flag Pattern: Highly Accurate Trading Outcome (Income Generator via Trading View)
Suffice it to say, Nvidia stock would go on to post a new all-time high of $140.76 on June 26th (trend wave movement is shown in the chart above). Of course, this means that the $138.41 price target that was projected by the chart pattern ultimately missed the actual highs by $2.35. Of course, achieving total accuracy in volatile assets like tech stocks or cryptocurrencies can be quite a difficult task.
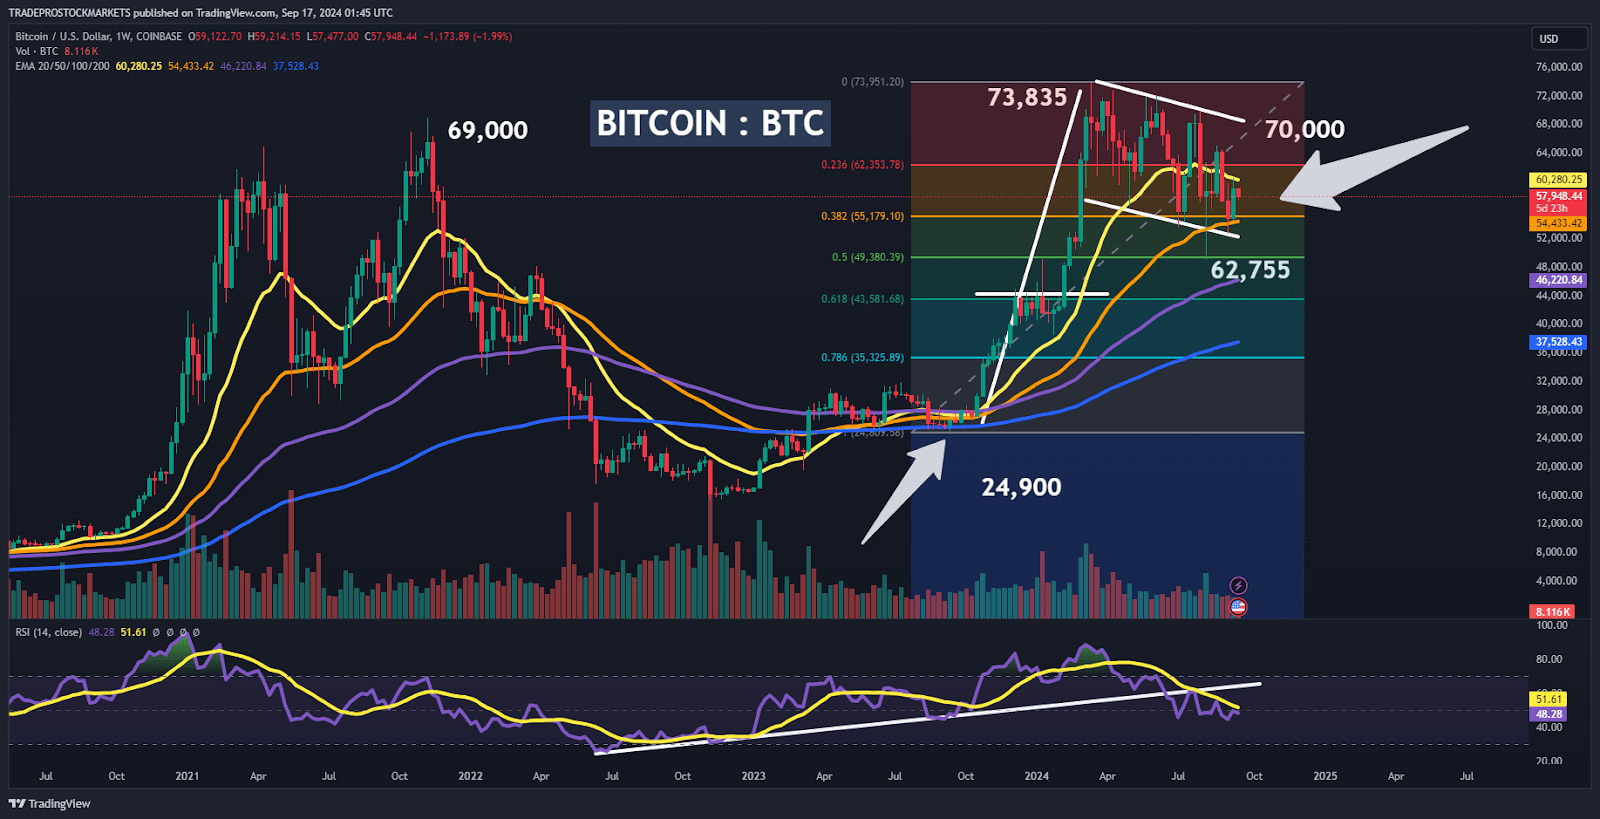
Bitcoin is one of the most volatile assets in the entire financial market, so I would not expect the current chart formation to be accurate within a few dollars of the ultimate projection. However, I think that these types of chart patterns can be incredibly useful in terms of their ability to give us a better sense of the trend directions that are most probable at any given moment. In this case, the bottom of the flag pattern in BTC-USD can be found at $24,900 because this is the price low from September 11th, 2023. This specific trend wave formed highs of $73,835.57 before reversing to form the sideways-downward parallel price channel shown in the initial chart images. Interestingly, this gives us a “flag pole” price distance of $48,935.57 and if we add this figure to the recent pattern breakout point found at $68,426.11 (October 18th highs), we arrive at a bullish trend-wave target of $117,361.68.
Of course, it must be understood that I do not expect these price projections to be accurate down to the penny. Cryptocurrencies are highly volatile assets that will quite often encounter slippage that will almost always prevent that type of accuracy from being possible. Overall, these price patterns are meant to use be used as a guide that allows us to identify potential price trends and possible reversal points within those trends. In the prior example seen with Nvidia earlier this year, the projected bullish price target wound up being accurate within a range of 1.66%. Bitcoin is obviously a much more volatile asset when compared to a mega-cap company that is counted within the coveted MAG-7 group, so I would not expect these projections to be quite as accurate.
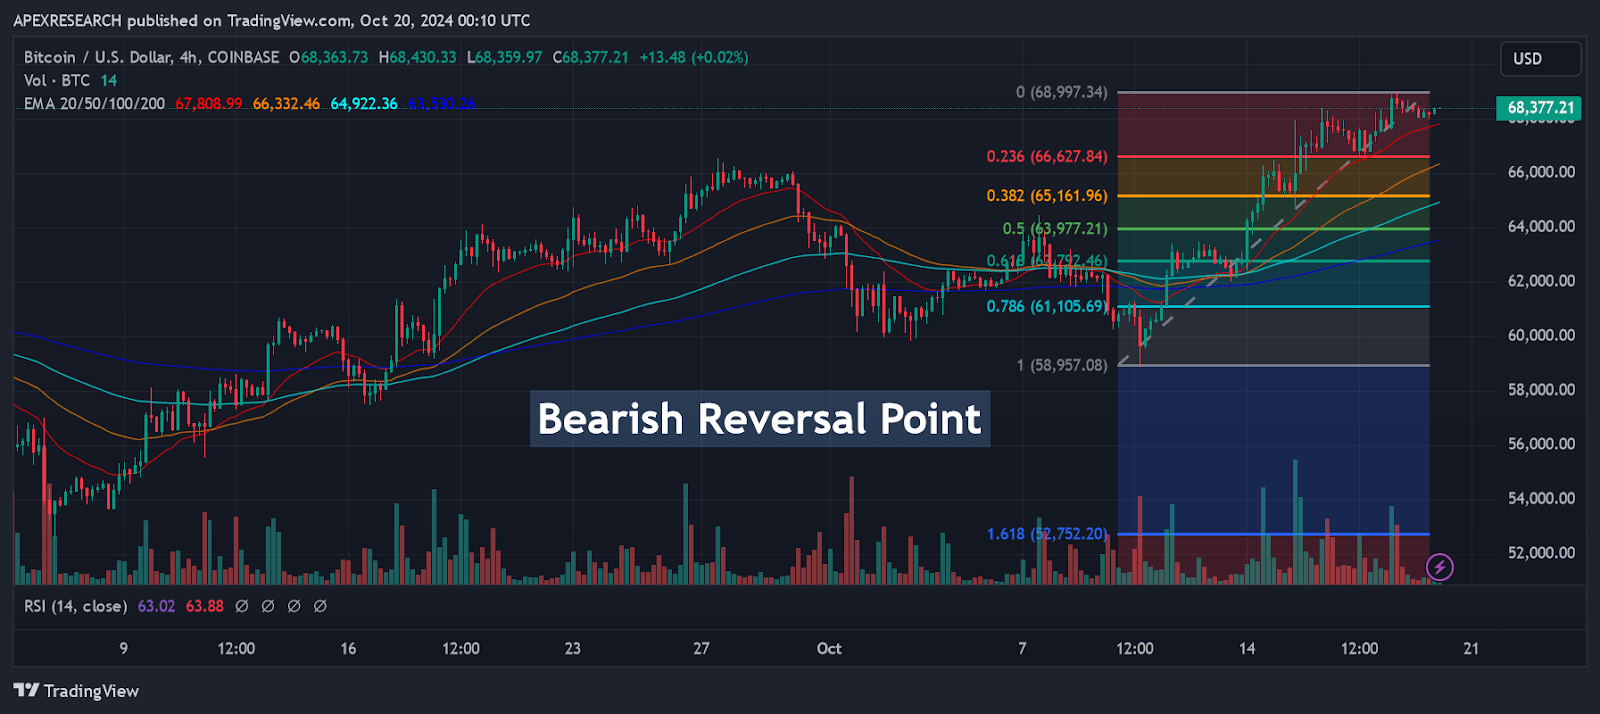
BTC-USD: Bearish Reversal Point (Income Generator via Trading View)
In order for me to reverse my position and adopt a more bearish outlook for BTC-USD, I would need to see market prices fall below the October 15th, 2024 lows of $64,778.44. Of course, this area closely aligns with a near-term 38.2% Fibonacci retracement zone when analyzing the move from $58,863.90 (October 10th low) to the October 18th highs of $69,000.62 (which is located near $65,160). Overall, however, the cryptocurrency’s current price structure is looking quite bullish, in my view, and these types of price patterns have already shown incredible success rates earlier this year. Now, that we have seen the critical price break in the upward direction, I think that current momentum levels have the ability to send BTC-USD prices above the coveted $100,000 mark for the first time in market history. We shall see if similar accuracy and success rates will be seen with this newly developed trend movements in cryptocurrency markets.